
Monitor_Control_Plane.md 4.8 KB
Monitoring The Management Station
To monitor the Management Station, Omnia uses the Grafana UI with a Loki integration (This can be set up using the steps provided here).
Accessing Loki via Grafana
Loki is a datastore used to efficiently hold log data for security purposes. Using the promtail agent, logs are collated and streamed via a HTTP API.
Note: When
control_plane.ymlis run, Loki is automatically set up as a data source on the Grafana UI.
Querying Loki
Loki uses basic regex based syntax to filter for specific jobs, dates or timestamps.
- Select the Explore
 tab to select control-plane-loki from the drop down.
 - Using LogQL queries, all logs in
/var/logcan be accessed using filters (Eg:{job=”Omnia”})
Viewing Logs on the Dashboard
All log files can be viewed via the Dashboard tab ( ). The Default Dashboard displays
 omnia.log and syslog. Custom dashboards can be created per user requirements.
Accessing Prometheus data via Grafana
- Once
control_plane.ymlis run, Prometheus is added to Grafana as a datasource. This allows Grafana to display statistics from the Control Plane that have been polled using Prometheus.
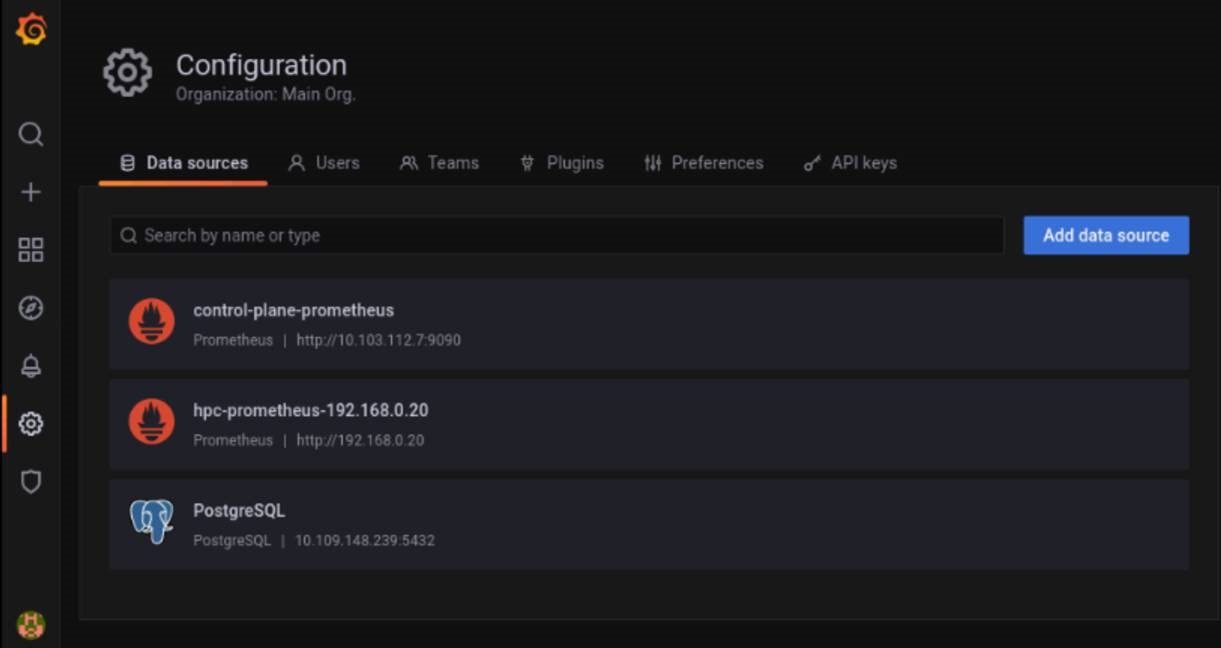
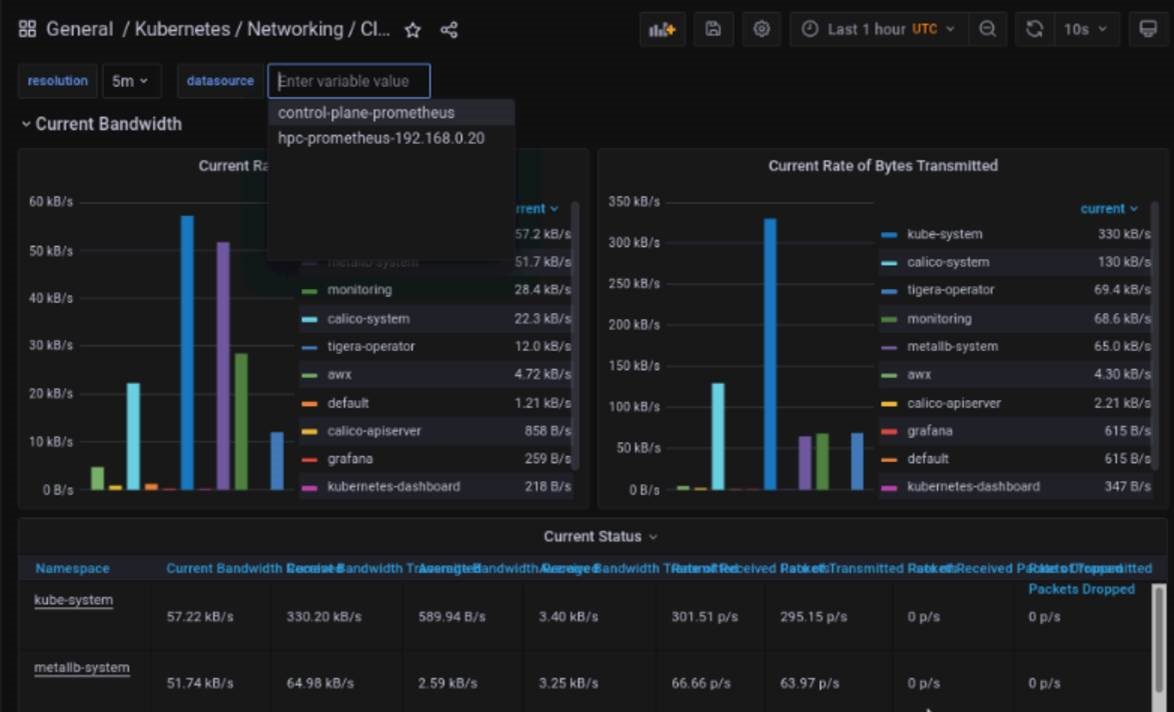
- Select the dashboard () tab to view the list of Prometheus based dashboards. Some default dashboards include CoreDNS, Prometheus Overview, Kuberenetes Networking etc.
Note: Both the control plane and HPC clusters can be monitored on these dashboards by toggling the datasource at the top of each dashboard:
| Data Source | Description | Source |
|---|---|---|
| hpc-prometheus-headnodeIP | Manages the Kuberenetes and Slurm Cluster on the Manager and Compute nodes. | This datasource is set up when Omnia.yml is run. |
| control_plane_prometheus | Monitors the Single Node cluster running on the Management Station | This datasource is set up when control_plane.yml is run. |
| Type | Subtype | Dashboard Name | Available DataSources |
|---|---|---|---|
| CoreDNS | control-plane-prometheus, hpc-prometheus-headnodeIP | ||
| Kuberenetes | API Types | control-plane-prometheus, hpc-prometheus-headnodeIP | |
| Kuberenetes | Compute Resources | Cluster | control-plane-prometheus, hpc-prometheus-headnodeIP |
| Kuberenetes | Compute Resources | Namespace (Pods) | control-plane-prometheus, hpc-prometheus-headnodeIP |
| Kuberenetes | Compute Resources | Node (Pods) | control-plane-prometheus, hpc-prometheus-headnodeIP |
| Kuberenetes | Compute Resources | Pod | control-plane-prometheus, hpc-prometheus-headnodeIP |
| Kuberenetes | Compute Resources | Workload | control-plane-prometheus, hpc-prometheus-headnodeIP |
| Kuberenetes | Kubelet | control-plane-prometheus, hpc-prometheus-headnodeIP | |
| Kuberenetes | Networking | Cluster | control-plane-prometheus, hpc-prometheus-headnodeIP |
| Kuberenetes | Networking | Namespace (Pods) | control-plane-prometheus, hpc-prometheus-headnodeIP |
| Kuberenetes | Networking | Namespace (Workload) | control-plane-prometheus, hpc-prometheus-headnodeIP |
| Kuberenetes | Networking | Pod | control-plane-prometheus, hpc-prometheus-headnodeIP |
| Kuberenetes | Networking | Workload | control-plane-prometheus, hpc-prometheus-headnodeIP |
| Kuberenetes | Scheduler | control-plane-prometheus, hpc-prometheus-headnodeIP | |
| Kuberenetes | Stateful Sets | control-plane-prometheus, hpc-prometheus-headnodeIP | |
| Prometheus Overview | control-plane-prometheus, hpc-prometheus-headnodeIP | ||
| Slurm | CPUs/GPUs, Jobs, Nodes, Scheduler | hpc-prometheus-headnodeIP | |
| Slurm | Node Exporter Server Metrics | hpc-prometheus-headnodeIP |