The DAG of burndown and couples analyses with UAST diff refining. Generated with hercules -burndown -burndown-people -couples -feature=uast -dry-run -dump-dag doc/dag.dot https://github.com/src-d/hercules
torvalds/linux line burndown (granularity 30, sampling 30, resampled by year)
There is an option to resample the bands inside `labours.py`, so that you can define a very precise distribution and visualize it different ways. Besides, resampling aligns the bands across periodic boundaries, e.g. months or years. Unresampled bands are apparently not aligned and start from the project's birth date. There is a [presentation](http://vmarkovtsev.github.io/techtalks-2017-moscow-lightning/) available. ### Installation You are going to need Go (>= v1.8) and Python 2 or 3. ``` go get -d gopkg.in/src-d/hercules.v3/cmd/hercules cd $GOPATH/src/gopkg.in/hercules.v3/cmd/hercules make ``` #### Windows Numpy and SciPy are requirements. Install the correct version by downloading the wheel from http://www.lfd.uci.edu/~gohlke/pythonlibs/#scipy. Couples analysis also needs Tensorflow. ### Usage ``` # Use "memory" go-git backend and display the burndown plot. "memory" is the fastest but the repository's git data must fit into RAM. hercules -burndown https://github.com/src-d/go-git | python3 labours.py -m project --resample month # Use "file system" go-git backend and print some basic information about the repository. hercules /path/to/cloned/go-git # Use "file system" go-git backend, cache the cloned repository to /tmp/repo-cache, use Protocol Buffers and display the burndown plot without resampling. hercules -burndown -pb https://github.com/git/git /tmp/repo-cache | python3 labours.py -m project -f pb --resample raw # Now something fun # Get the linear history from git rev-list, reverse it # Pipe to hercules, produce burndown snapshots for every 30 days grouped by 30 days # Save the raw data to cache.yaml, so that later is possible to python3 labours.py -i cache.yaml # Pipe the raw data to labours.py, set text font size to 16pt, use Agg matplotlib backend and save the plot to output.png git rev-list HEAD | tac | hercules -commits - -burndown https://github.com/git/git | tee cache.yaml | python3 labours.py -m project --font-size 16 --backend Agg --output git.png ``` `labours.py -i /path/to/yaml` allows to read the output from `hercules` which was saved on disk. #### Caching It is possible to store the cloned repository on disk. The subsequent analysis can run on the corresponding directory instead of cloning from scratch: ``` # First time - cache hercules https://github.com/git/git /tmp/repo-cache # Second time - use the cache hercules -some-analysis /tmp/repo-cache ``` #### Docker image ``` docker run --rm srcd/hercules hercules -burndown -pb https://github.com/git/git | docker run --rm -i -v $(pwd):/io srcd/hercules labours.py -f pb -m project -o /io/git_git.png ``` ### Built-in analyses #### Project burndown ``` hercules -burndown python3 labours.py -m project ``` Line burndown statistics for the whole repository. Exactly the same what [git-of-theseus](https://github.com/erikbern/git-of-theseus) does but much faster. Blaming is performed efficiently and incrementally using a custom RB tree tracking algorithm, and only the last modification date is recorded while running the analysis. All burndown analyses depend on the values of *granularity* and *sampling*. Granularity is the number of days each band in the stack consists of. Sampling is the frequency with which the burnout state is snapshotted. The smaller the value, the more smooth is the plot but the more work is done. #### Files ``` hercules -burndown -burndown-files python3 labours.py -m files ``` Burndown statistics for every file in the repository which is alive in the latest revision. #### People ``` hercules -burndown -burndown-people [-people-dict=/path/to/identities] python3 labours.py -m person ``` Burndown statistics for the repository's contributors. If `-people-dict` is not specified, the identities are discovered by the following algorithm: 0. We start from the root commit towards the HEAD. Emails and names are converted to lower case. 1. If we process an unknown email and name, record them as a new developer. 2. If we process a known email but unknown name, match to the developer with the matching email, and add the unknown name to the list of that developer's names. 3. If we process an unknown email but known name, match to the developer with the matching name, and add the unknown email to the list of that developer's emails. If `-people-dict` is specified, it should point to a text file with the custom identities. The format is: every line is a single developer, it contains all the matching emails and names separated by `|`. The case is ignored. #### Churn matrix 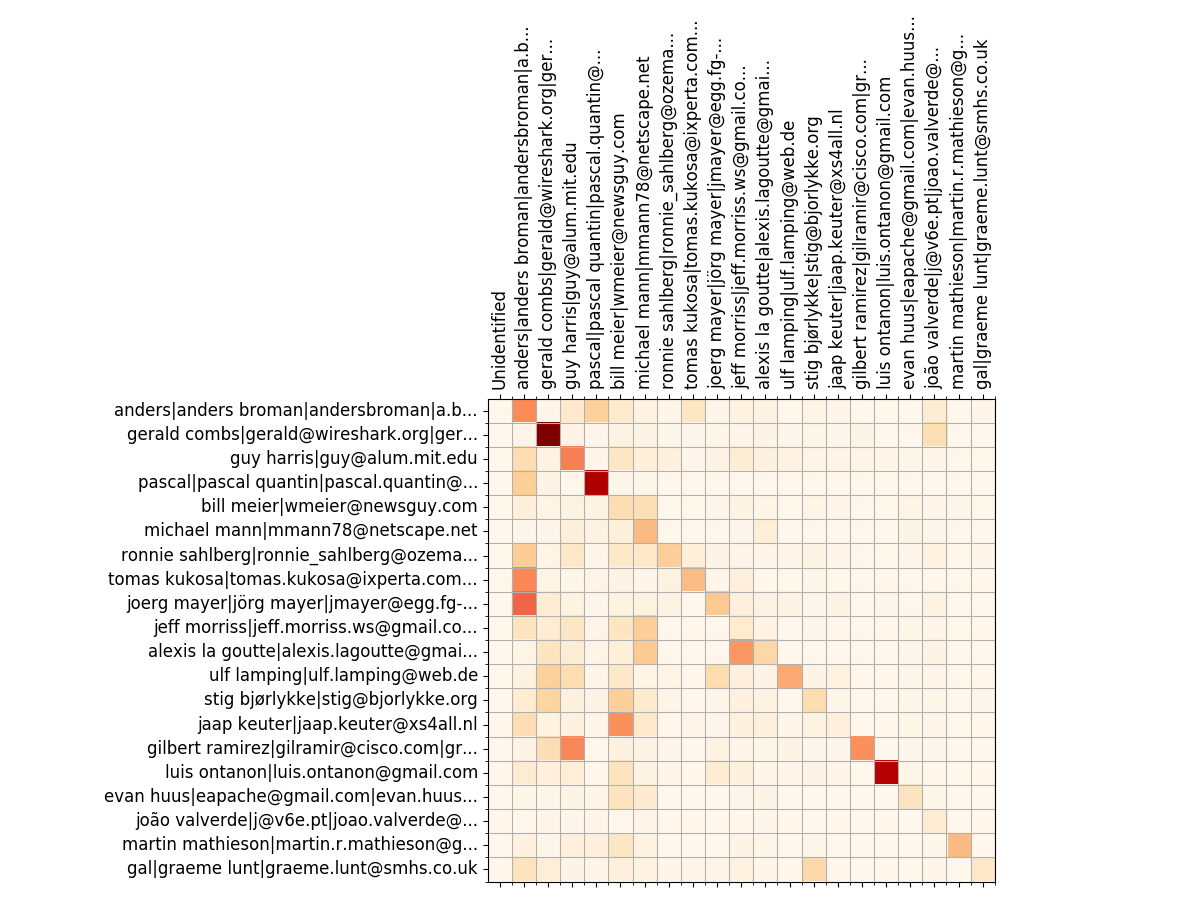Wireshark top 20 devs - churn matrix
``` hercules -burndown -burndown-people [-people-dict=/path/to/identities] python3 labours.py -m churn_matrix ``` Besides the burndown information, `-people` collects the added and deleted line statistics per developer. It shows how many lines written by developer A are removed by developer B. The format is the matrix with N rows and (N+2) columns, where N is the number of developers. 1. First column is the number of lines the developer wrote. 2. Second column is how many lines were written by the developer and deleted by unidentified developers (if `-people-dict` is not specified, it is always 0). 3. The rest of the columns show how many lines were written by the developer and deleted by identified developers. The sequence of developers is stored in `people_sequence` YAML node. #### Code ownership 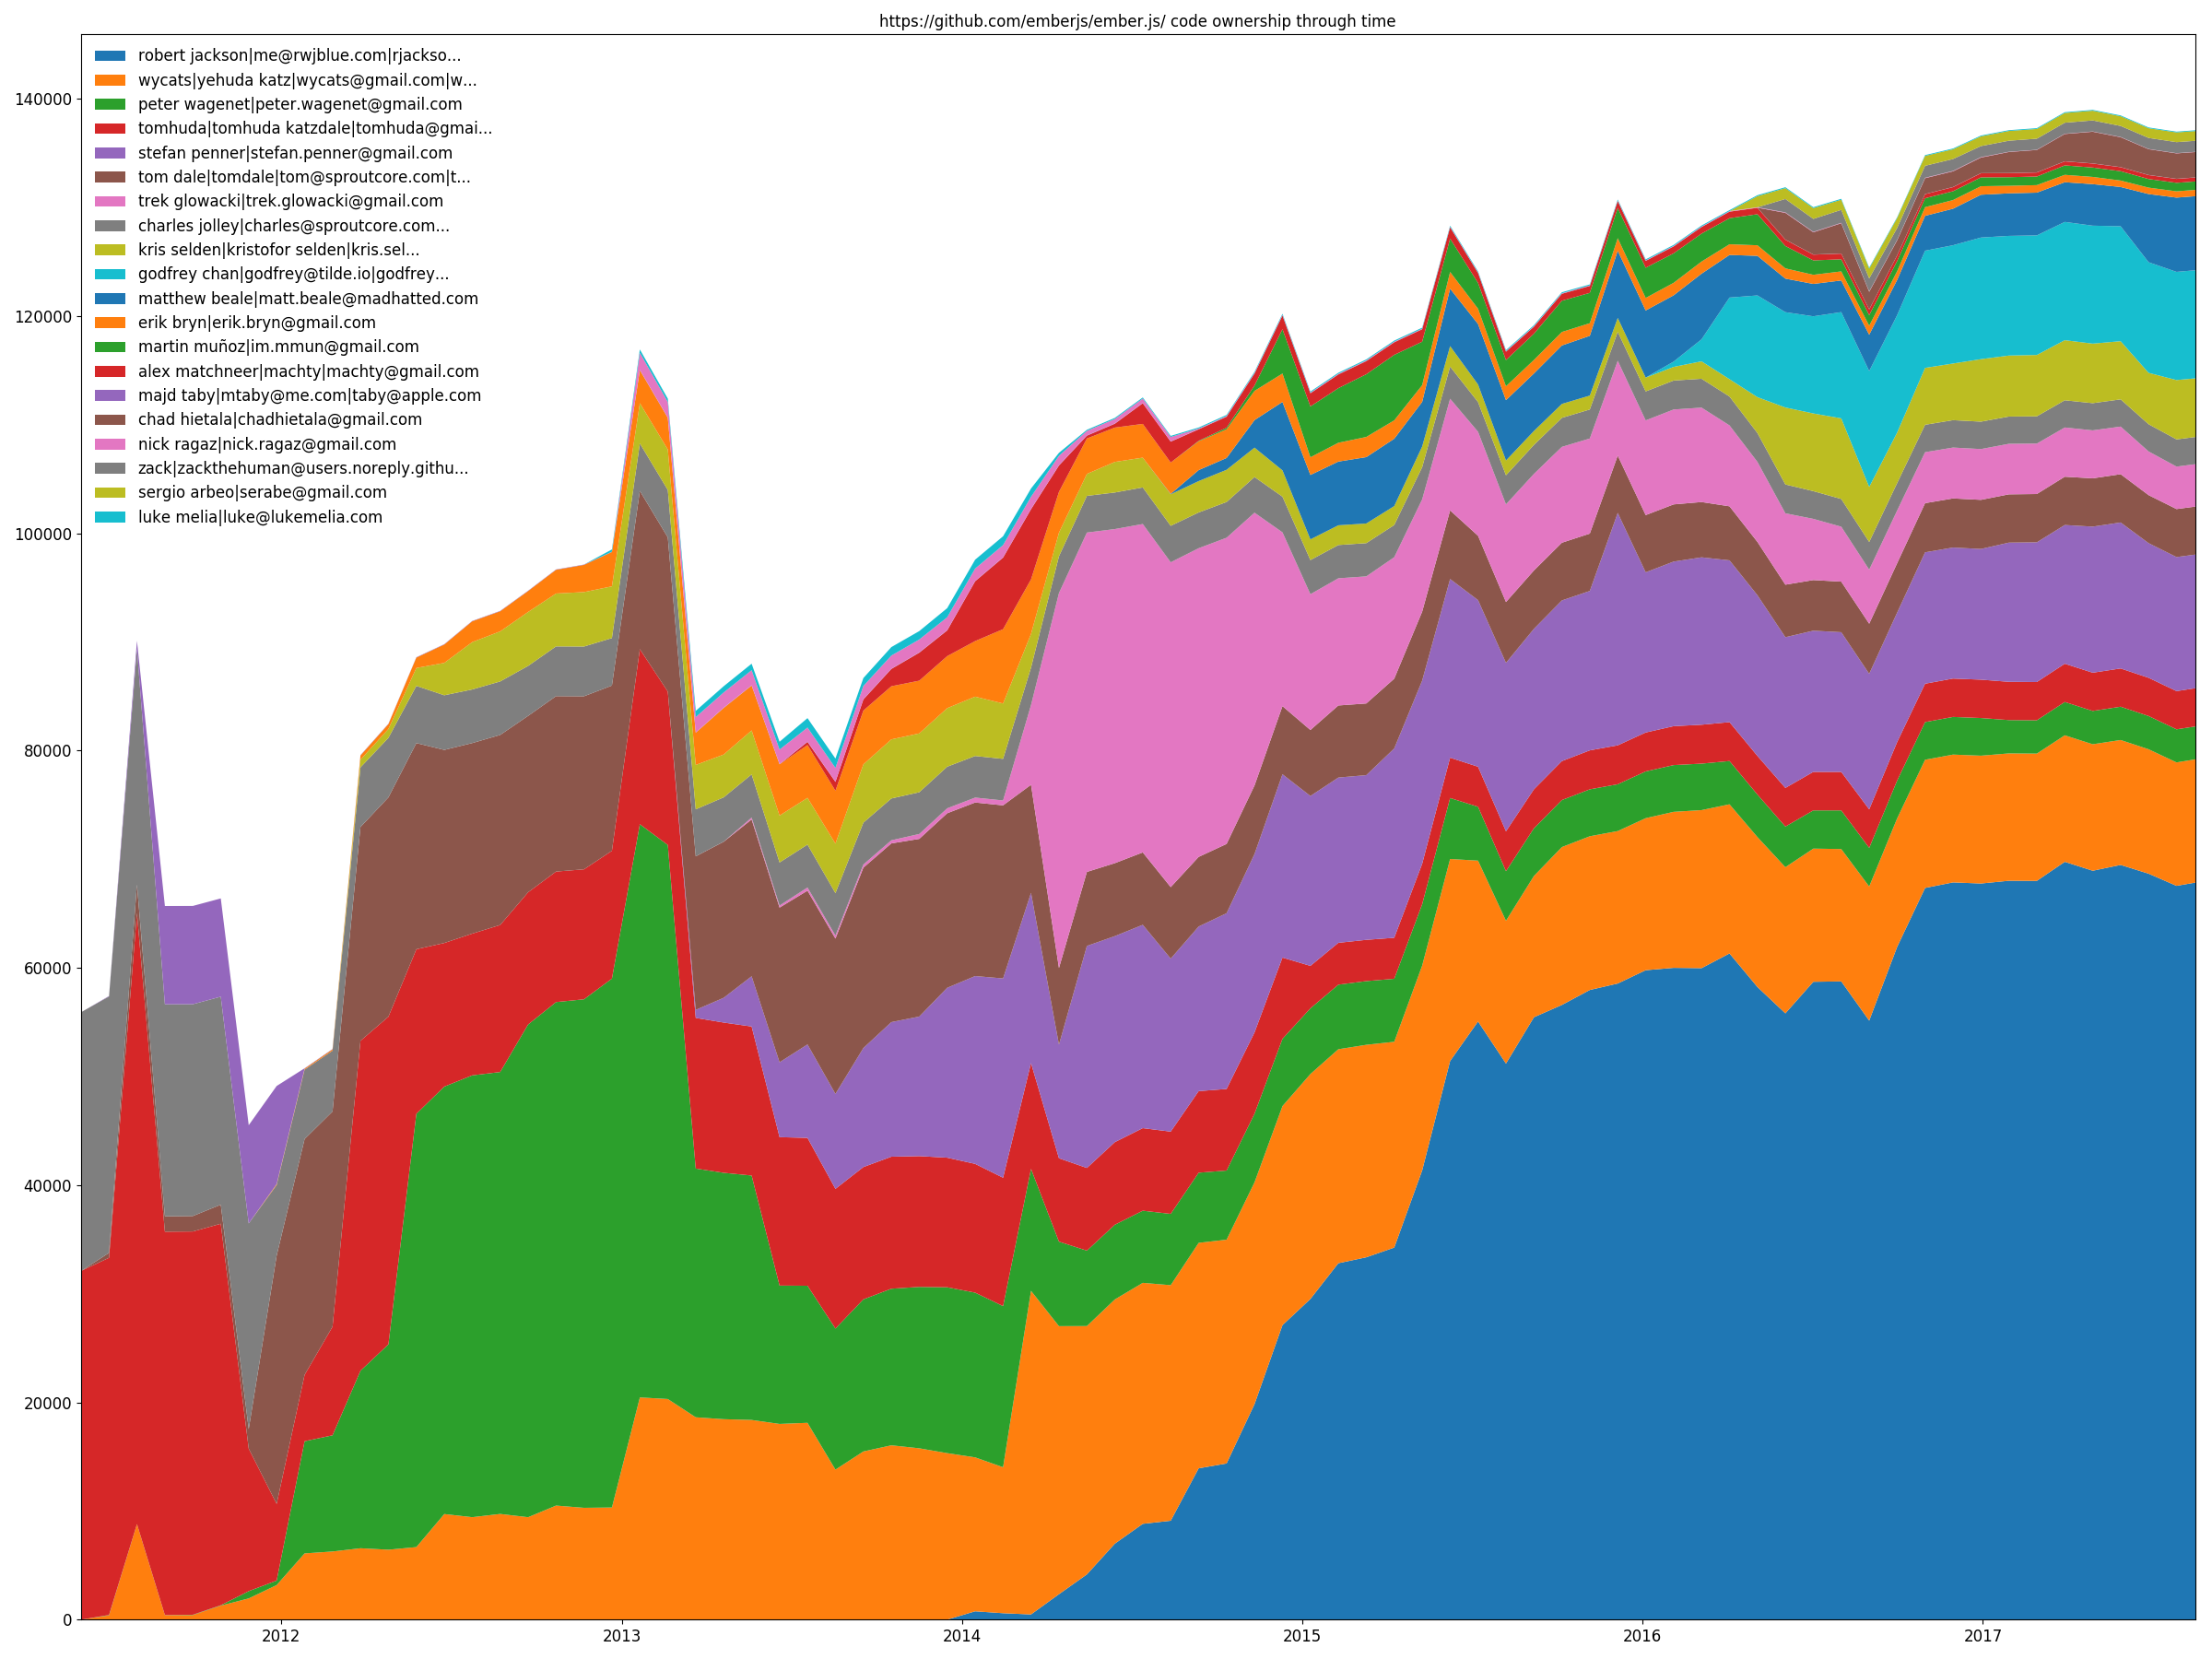Ember.js top 20 devs - code ownership
``` hercules -burndown -burndown-people [-people-dict=/path/to/identities] python3 labours.py -m ownership ``` `-people` also allows to draw the code share through time stacked area plot. That is, how many lines are alive at the sampled moments in time for each identified developer. #### Couples 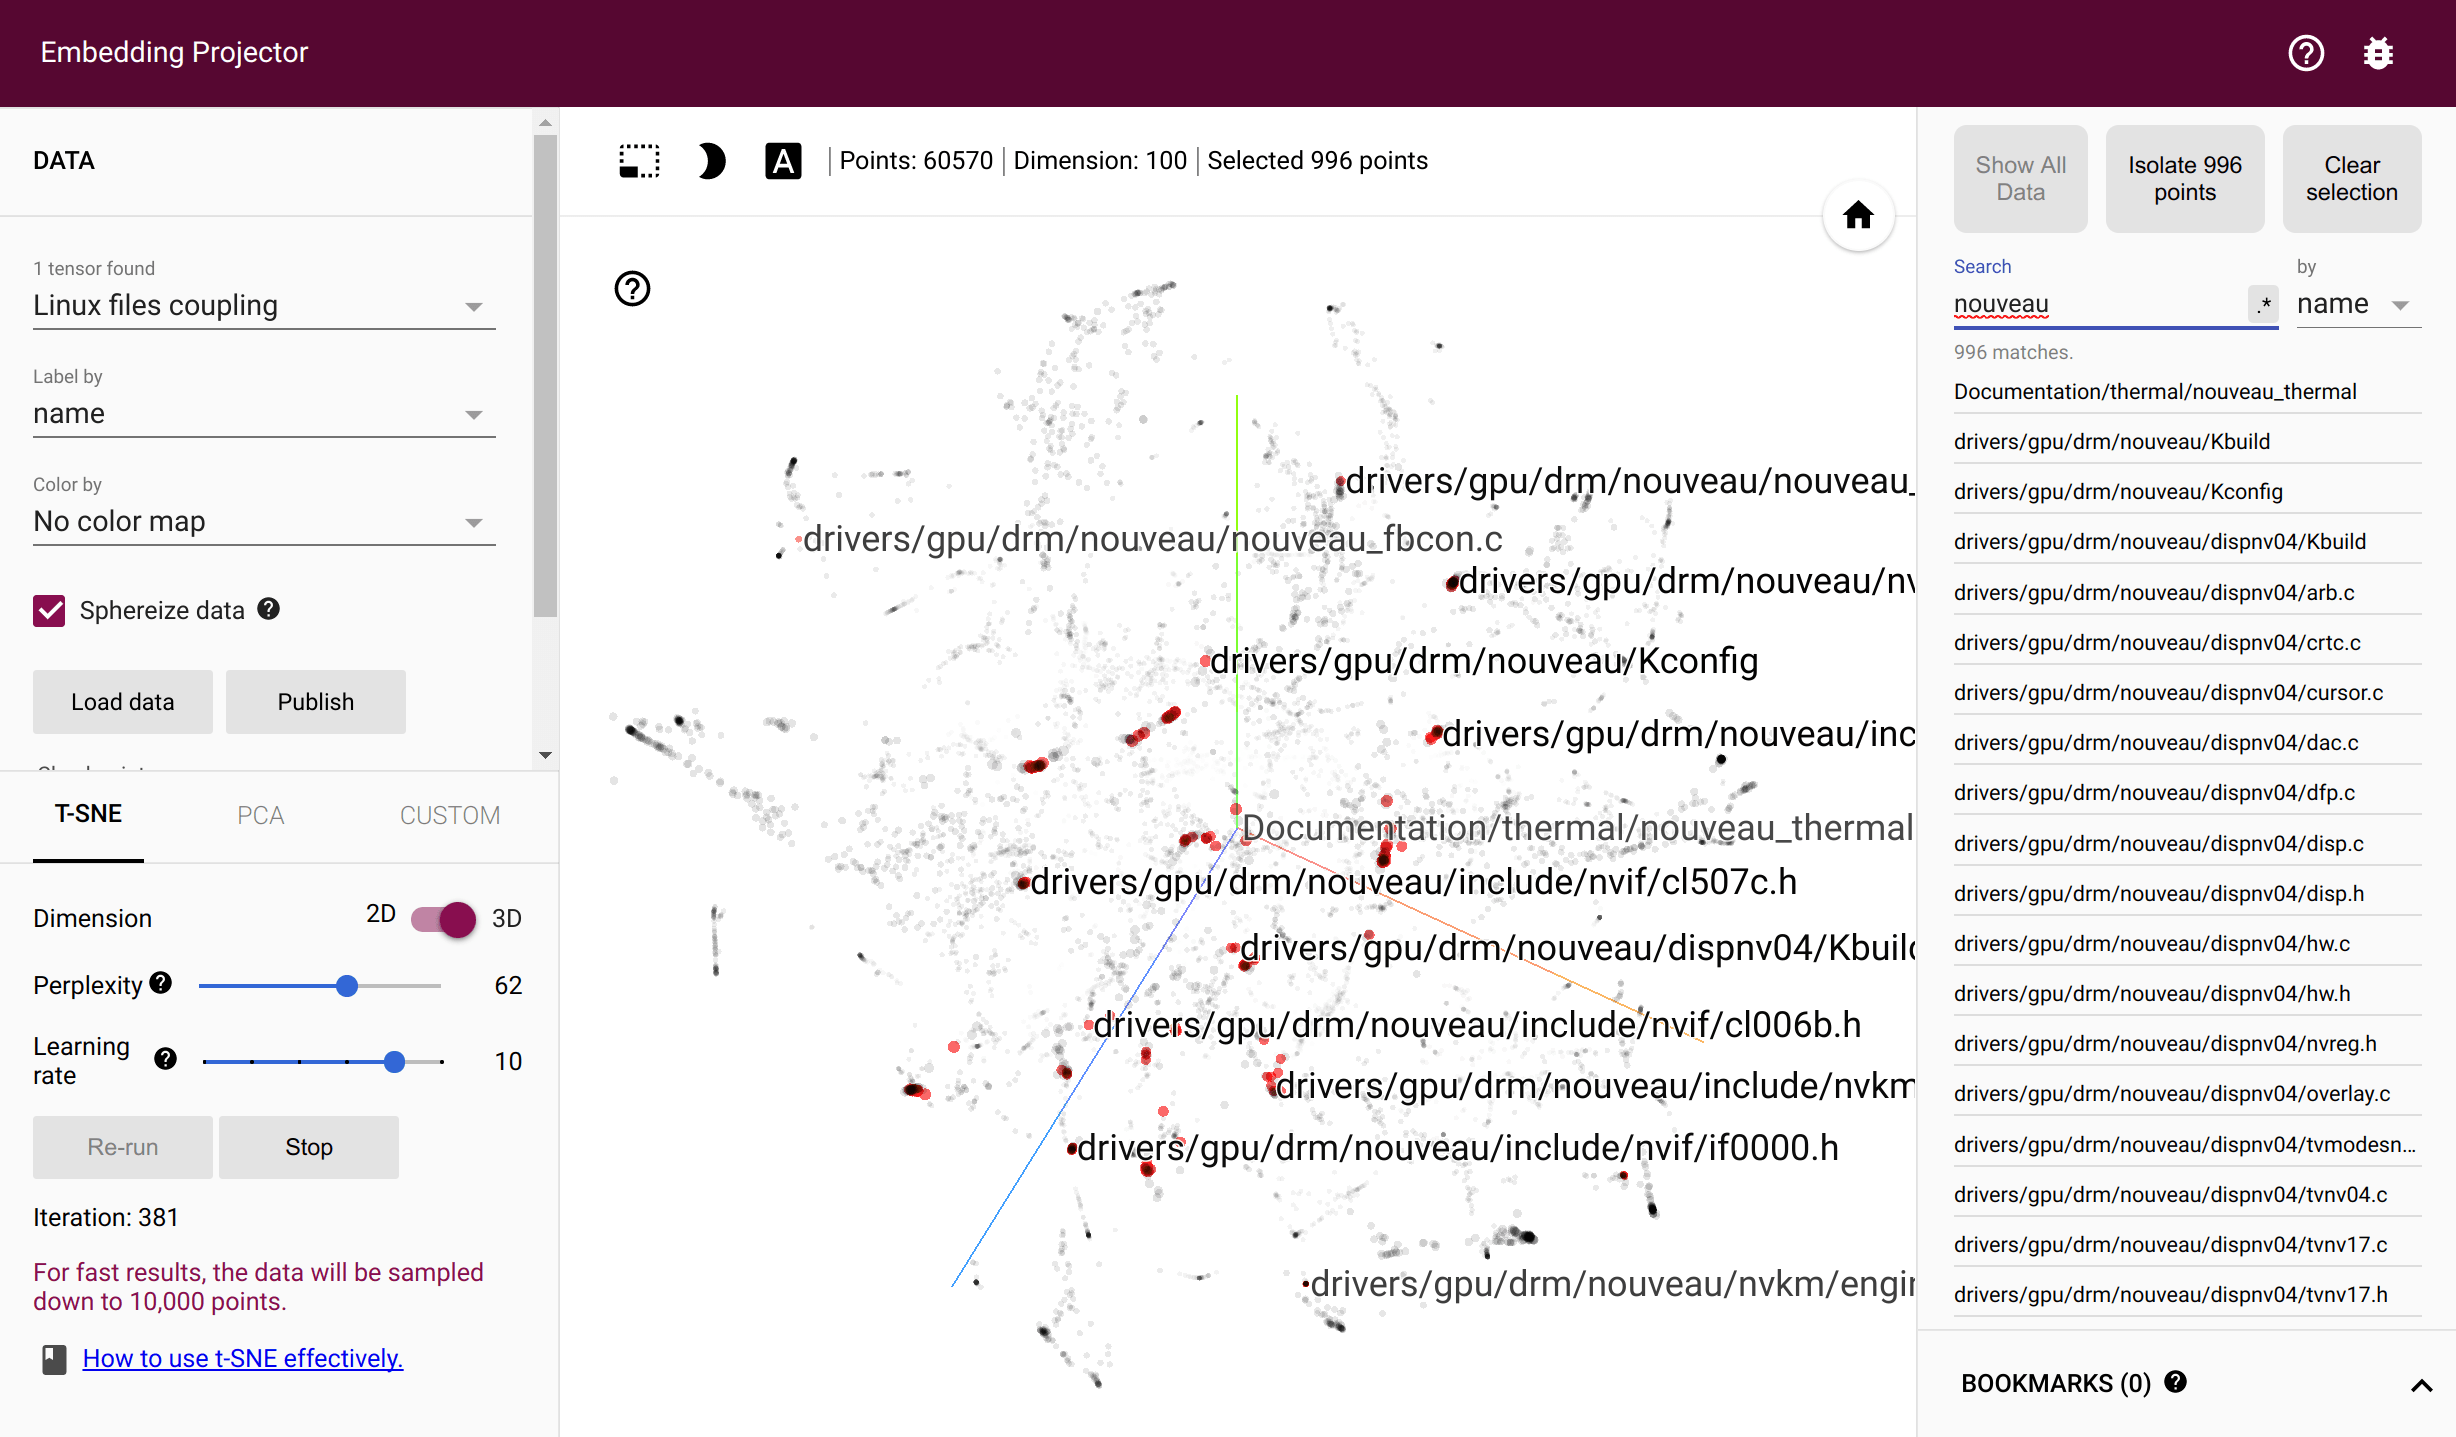torvalds/linux files' coupling in Tensorflow Projector
``` hercules -couples [-people-dict=/path/to/identities] python3 labours.py -m couples -o