Hercules [](https://travis-ci.org/src-d/hercules) [](https://codecov.io/gh/src-d/hercules)
--------
This project calculates and plots the lines burndown and other fun stats in Git repositories.
Exactly the same what [git-of-theseus](https://github.com/erikbern/git-of-theseus)
does actually, but using [go-git](https://github.com/src-d/go-git).
Why? [source{d}](http://sourced.tech) builds it's own data pipeline to
process every git repository in the world and the calculation of the
annual burnout ratio will be embedded into it. `hercules` contains an
open source implementation of the specific `git blame` flavour on top
of go-git. Blaming is performed incrementally using the custom RB tree tracking
algorithm, only the last modification date is recorded.
There are two tools: `hercules` and `labours.py`. The first is the program
written in Go which collects the burndown and other stats from a Git repository.
The second is the Python script which draws the stack area plots and optionally
resamples the time series. These two tools are normally used together through
the pipe. `hercules` prints results in plain text. The first line is four numbers:
UNIX timestamp which corresponds to the time the repository was created,
UNIX timestamp of the last commit, *granularity* and *sampling*.
Granularity is the number of days each band in the stack consists of. Sampling
is the frequency with which the burnout state is snapshotted. The smaller the
value, the more smooth is the plot but the more work is done.
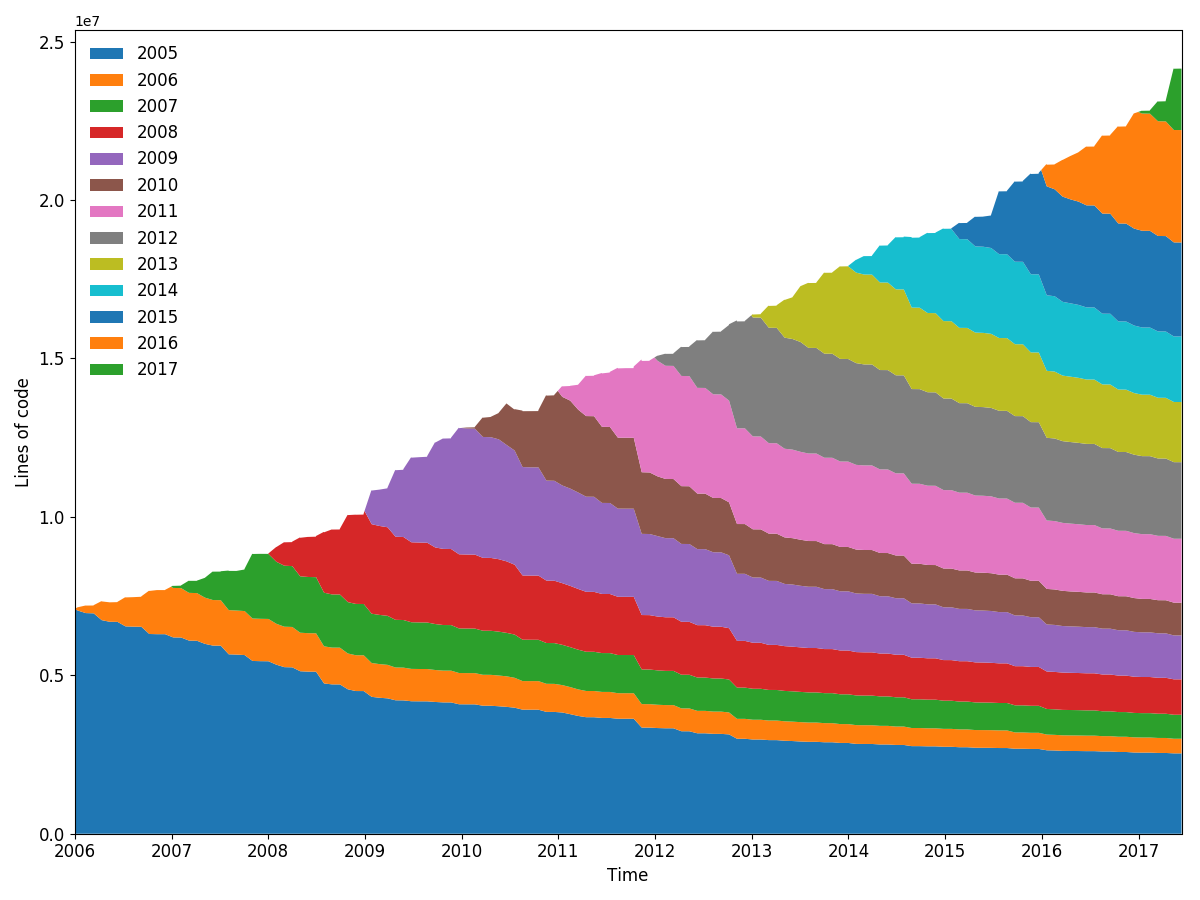
torvalds/linux burndown (granularity 30, sampling 30, resampled by year)
There is an option to resample the bands inside `labours.py`, so that you can
define a very precise distribution and visualize it different ways. Besides,
resampling aligns the bands across periodic boundaries, e.g. months or years.
Unresampled bands are apparently not aligned and start from the project's birth date.
There is a [presentation](http://vmarkovtsev.github.io/techtalks-2017-moscow-lightning/) available.
### Installation
You are going to need Go (>= v1.8) and Python 2 or 3.
```
go get gopkg.in/src-d/hercules.v2/cmd/hercules
pip install -r requirements.txt
wget https://github.com/src-d/hercules/raw/master/labours.py
```
#### Windows
Numpy and SciPy are requirements. Install the correct version by downloading the wheel from http://www.lfd.uci.edu/~gohlke/pythonlibs/#scipy.
### Usage
```
# Use "memory" go-git backend and display the plot. This is the fastest but the repository data must fit into RAM.
hercules https://github.com/src-d/go-git | python3 labours.py --resample month
# Use "file system" go-git backend and print the raw data.
hercules /path/to/cloned/go-git
# Use "file system" go-git backend, cache the cloned repository to /tmp/repo-cache, use Protocol Buffers and display the unresampled plot.
hercules -pb https://github.com/git/git /tmp/repo-cache | python3 labours.py -f pb --resample raw
# Now something fun
# Get the linear history from git rev-list, reverse it
# Pipe to hercules, produce the snapshots for every 30 days grouped by 30 days
# Save the raw data to cache.yaml, so that later is possible to python3 labours.py -i cache.yaml
# Pipe the raw data to labours.py, set text font size to 16pt, use Agg matplotlib backend and save the plot to output.png
git rev-list HEAD | tac | hercules -commits - https://github.com/git/git | tee cache.yaml | python3 labours.py --font-size 16 --backend Agg --output git.png
```
`labours.py -i /path/to/yaml` allows to read the output from `hercules` which was saved on disk.
#### Caching
It is possible to store the cloned repository on disk. The subsequent analysis can run on the
corresponding directory instead of cloning from scratch:
```
# First time - cache
hercules https://github.com/git/git /tmp/repo-cache
# Second time - use the cache
hercules /tmp/repo-cache
```
#### Docker image
```
docker run --rm srcd/hercules hercules -pb https://github.com/git/git | docker run --rm -i -v $(pwd):/io srcd/hercules labours.py -f pb -o /io/git_git.png
```
### Extensions
#### Files
```
hercules -files
python3 labours.py -m files
```
Burndown statistics for every file in the repository which is alive in the latest revision.
#### People
```
hercules -people [-people-dict=/path/to/identities]
python3 labours.py -m person
```
Burndown statistics for developers. If `-people-dict` is not specified, the identities are
discovered by the following algorithm:
0. We start from the root commit towards the HEAD. Emails and names are converted to lower case.
1. If we process an unknown email and name, record them as a new developer.
2. If we process a known email but unknown name, match to the developer with the matching email,
and add the unknown name to the list of that developer's names.
3. If we process an unknown email but known name, match to the developer with the matching name,
and add the unknown email to the list of that developer's emails.
If `-people-dict` is specified, it should point to a text file with the custom identities. The
format is: every line is a single developer, it contains all the matching emails and names separated
by `|`. The case is ignored.
#### Churn matrix
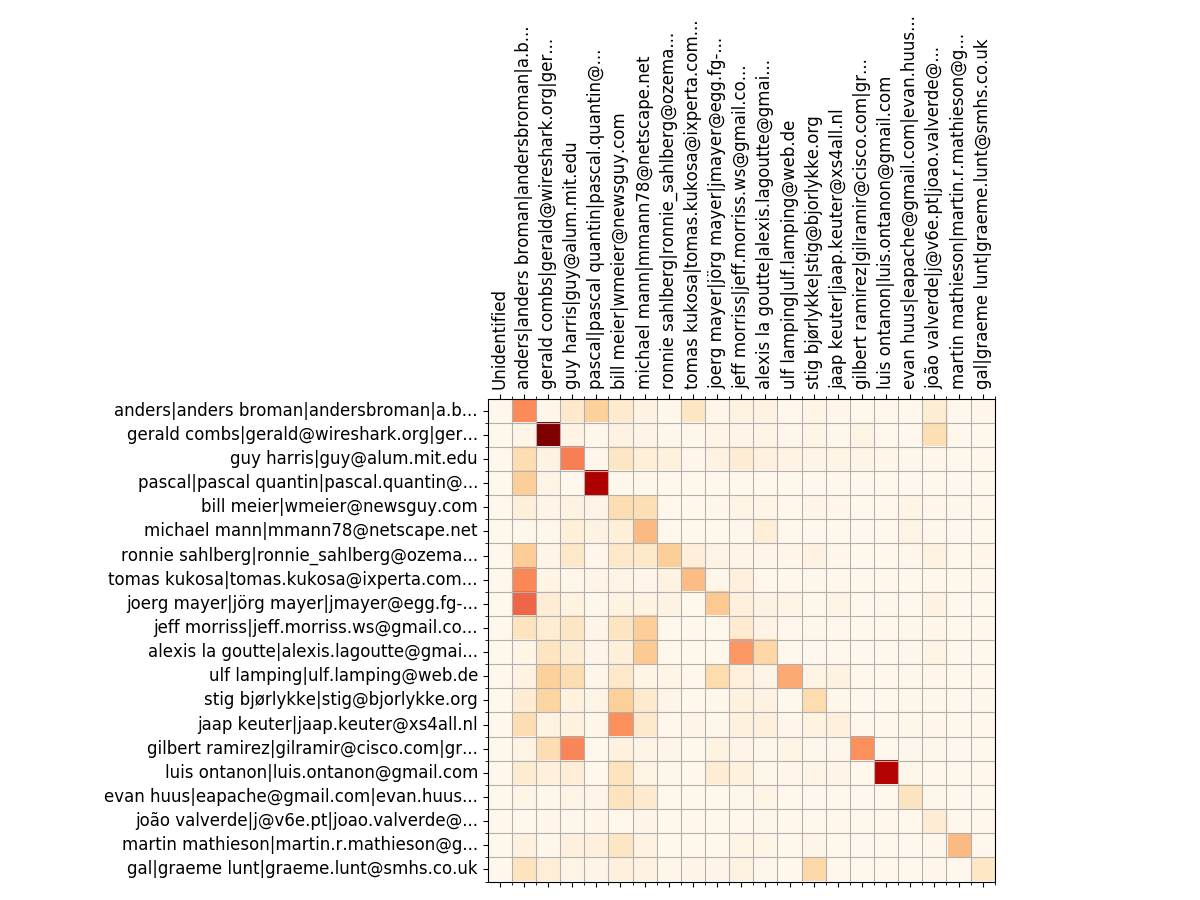
Wireshark top 20 devs - churn matrix
```
hercules -people [-people-dict=/path/to/identities]
python3 labours.py -m churn_matrix
```
Besides the burndown information, `-people` collects the added and deleted line statistics per
developer. It shows how many lines written by developer A are removed by developer B. The format is
the matrix with N rows and (N+2) columns, where N is the number of developers.
1. First column is the number of lines the developer wrote.
2. Second column is how many lines were written by the developer and deleted by unidentified developers
(if `-people-dict` is not specified, it is always 0).
3. The rest of the columns show how many lines were written by the developer and deleted by identified
developers.
The sequence of developers is stored in `people_sequence` YAML node.
#### Code ownership
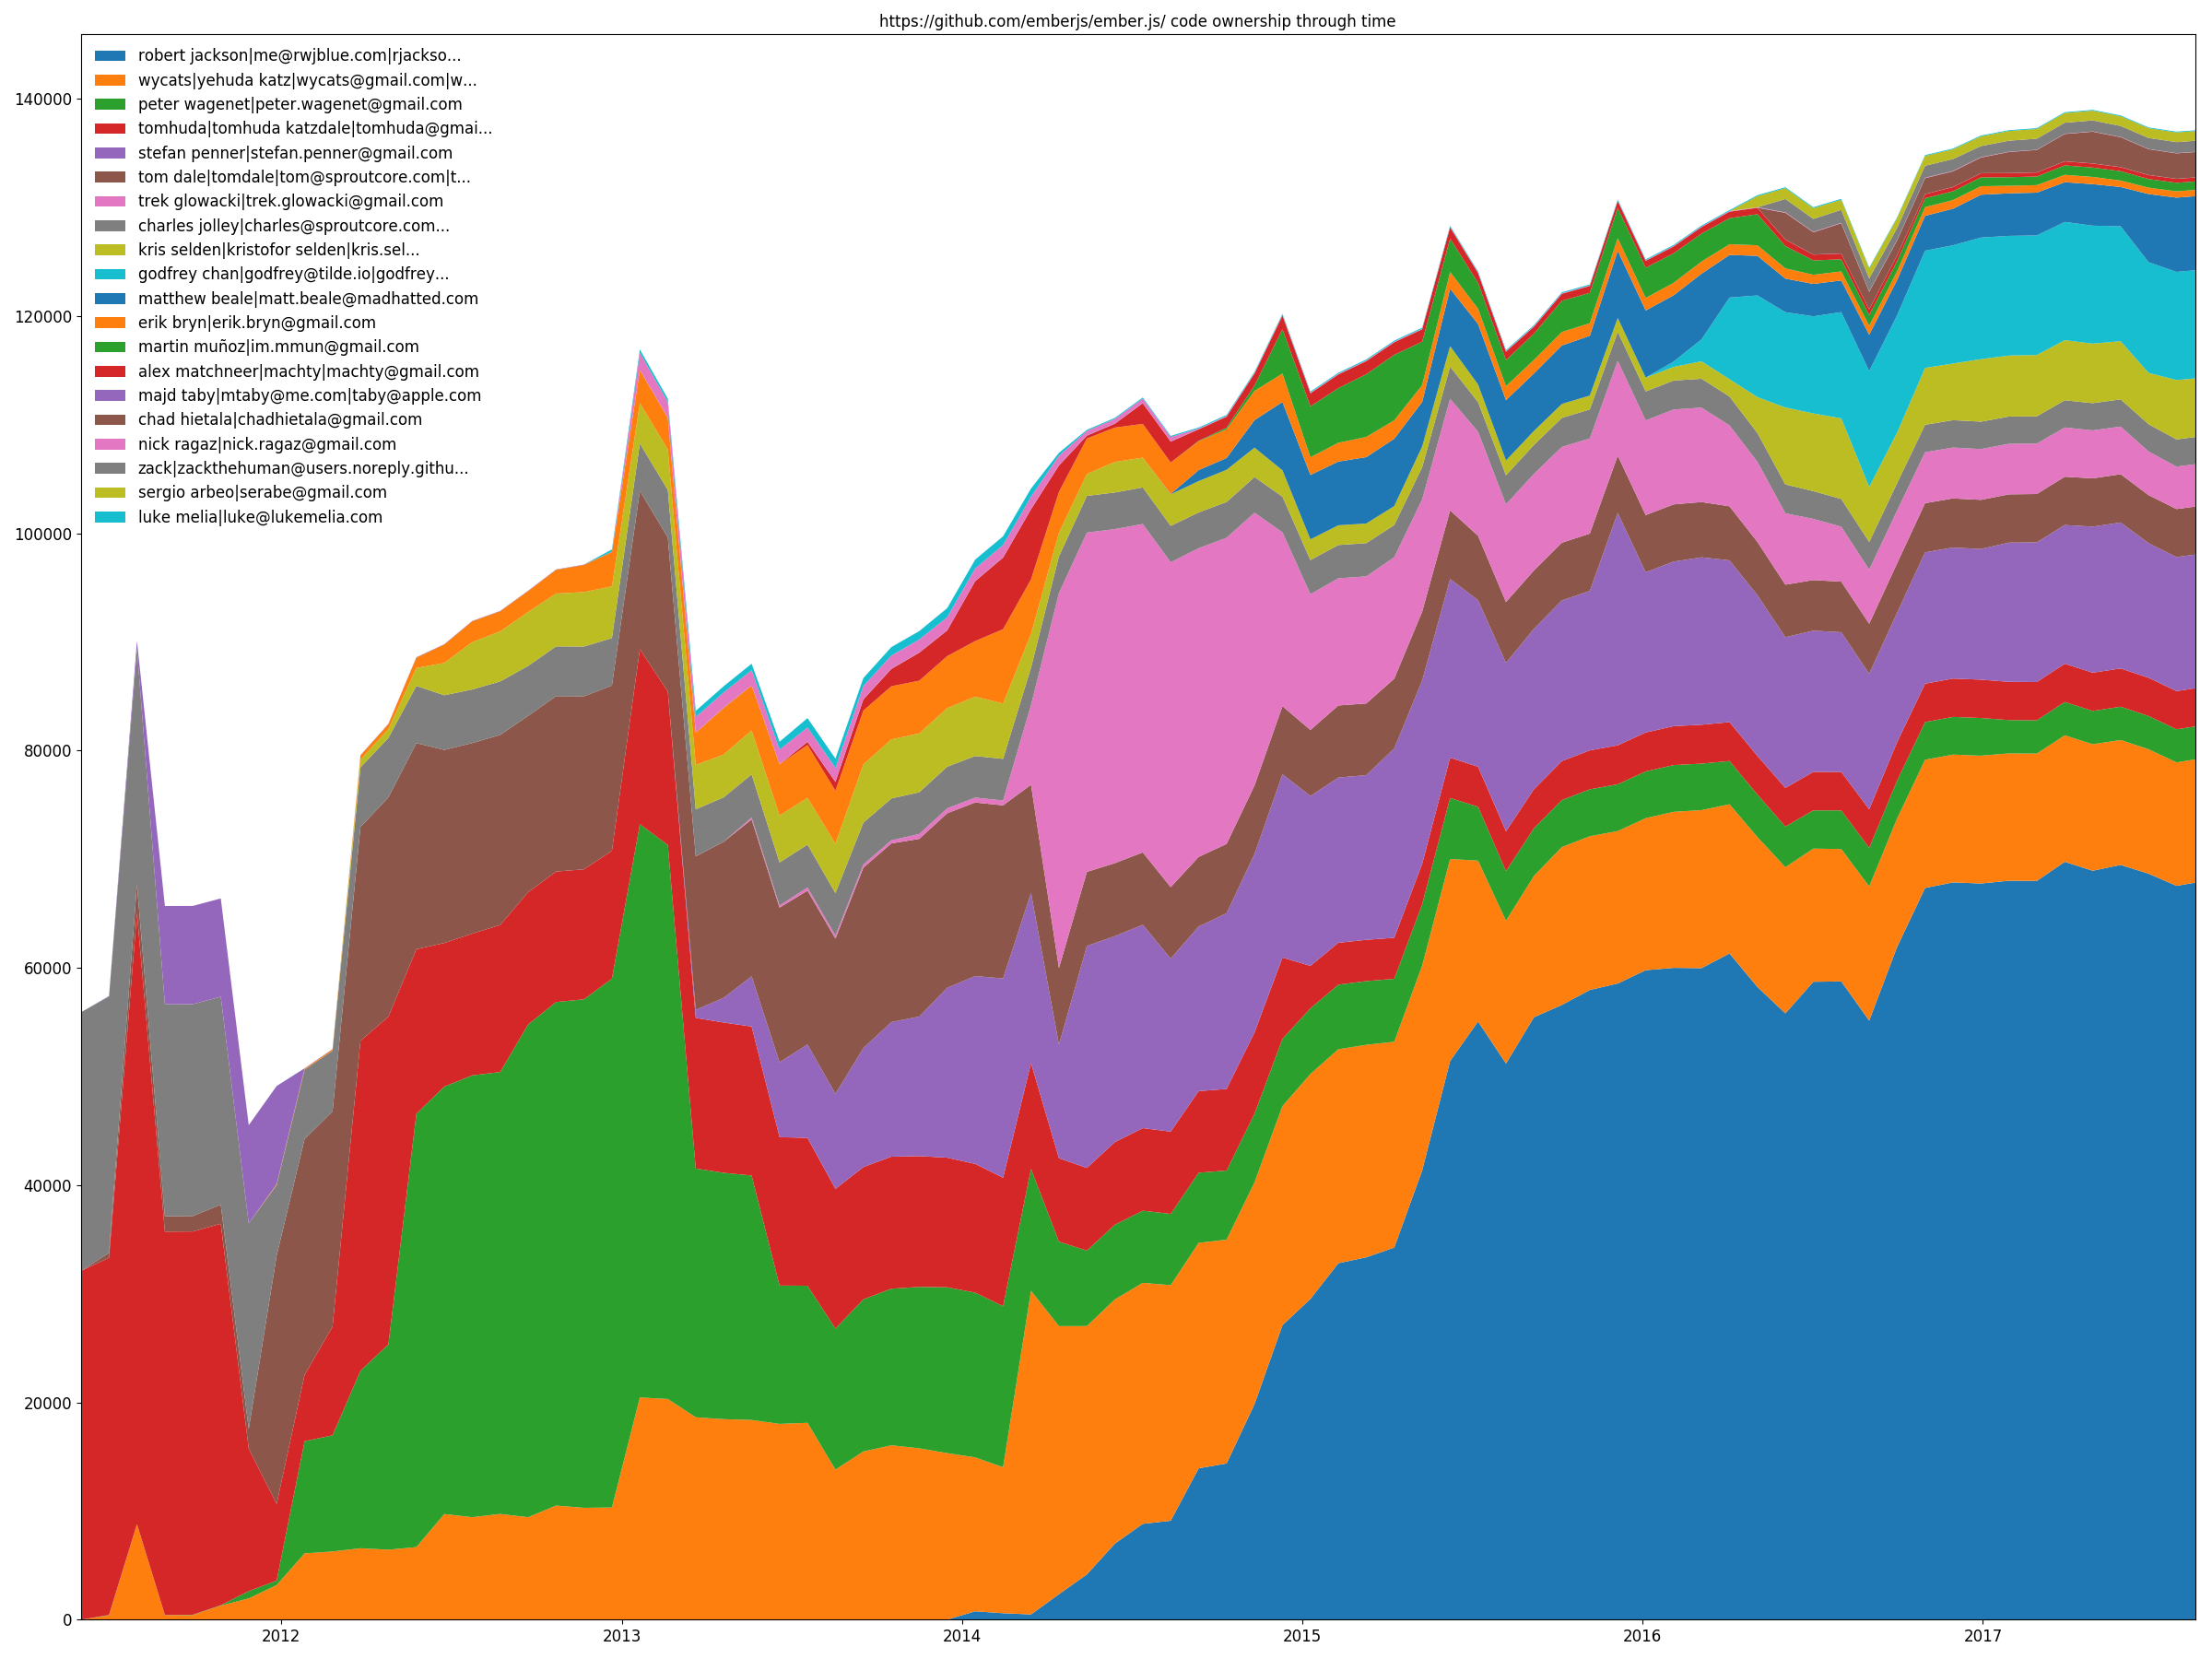
Ember.js top 20 devs - code ownership
```
hercules -people [-people-dict=/path/to/identities]
python3 labours.py -m ownership
```
`-people` also allows to draw the code share through time stacked area plot. That is,
how many lines are alive at the sampled moments in time for each identified developer.
#### Couples
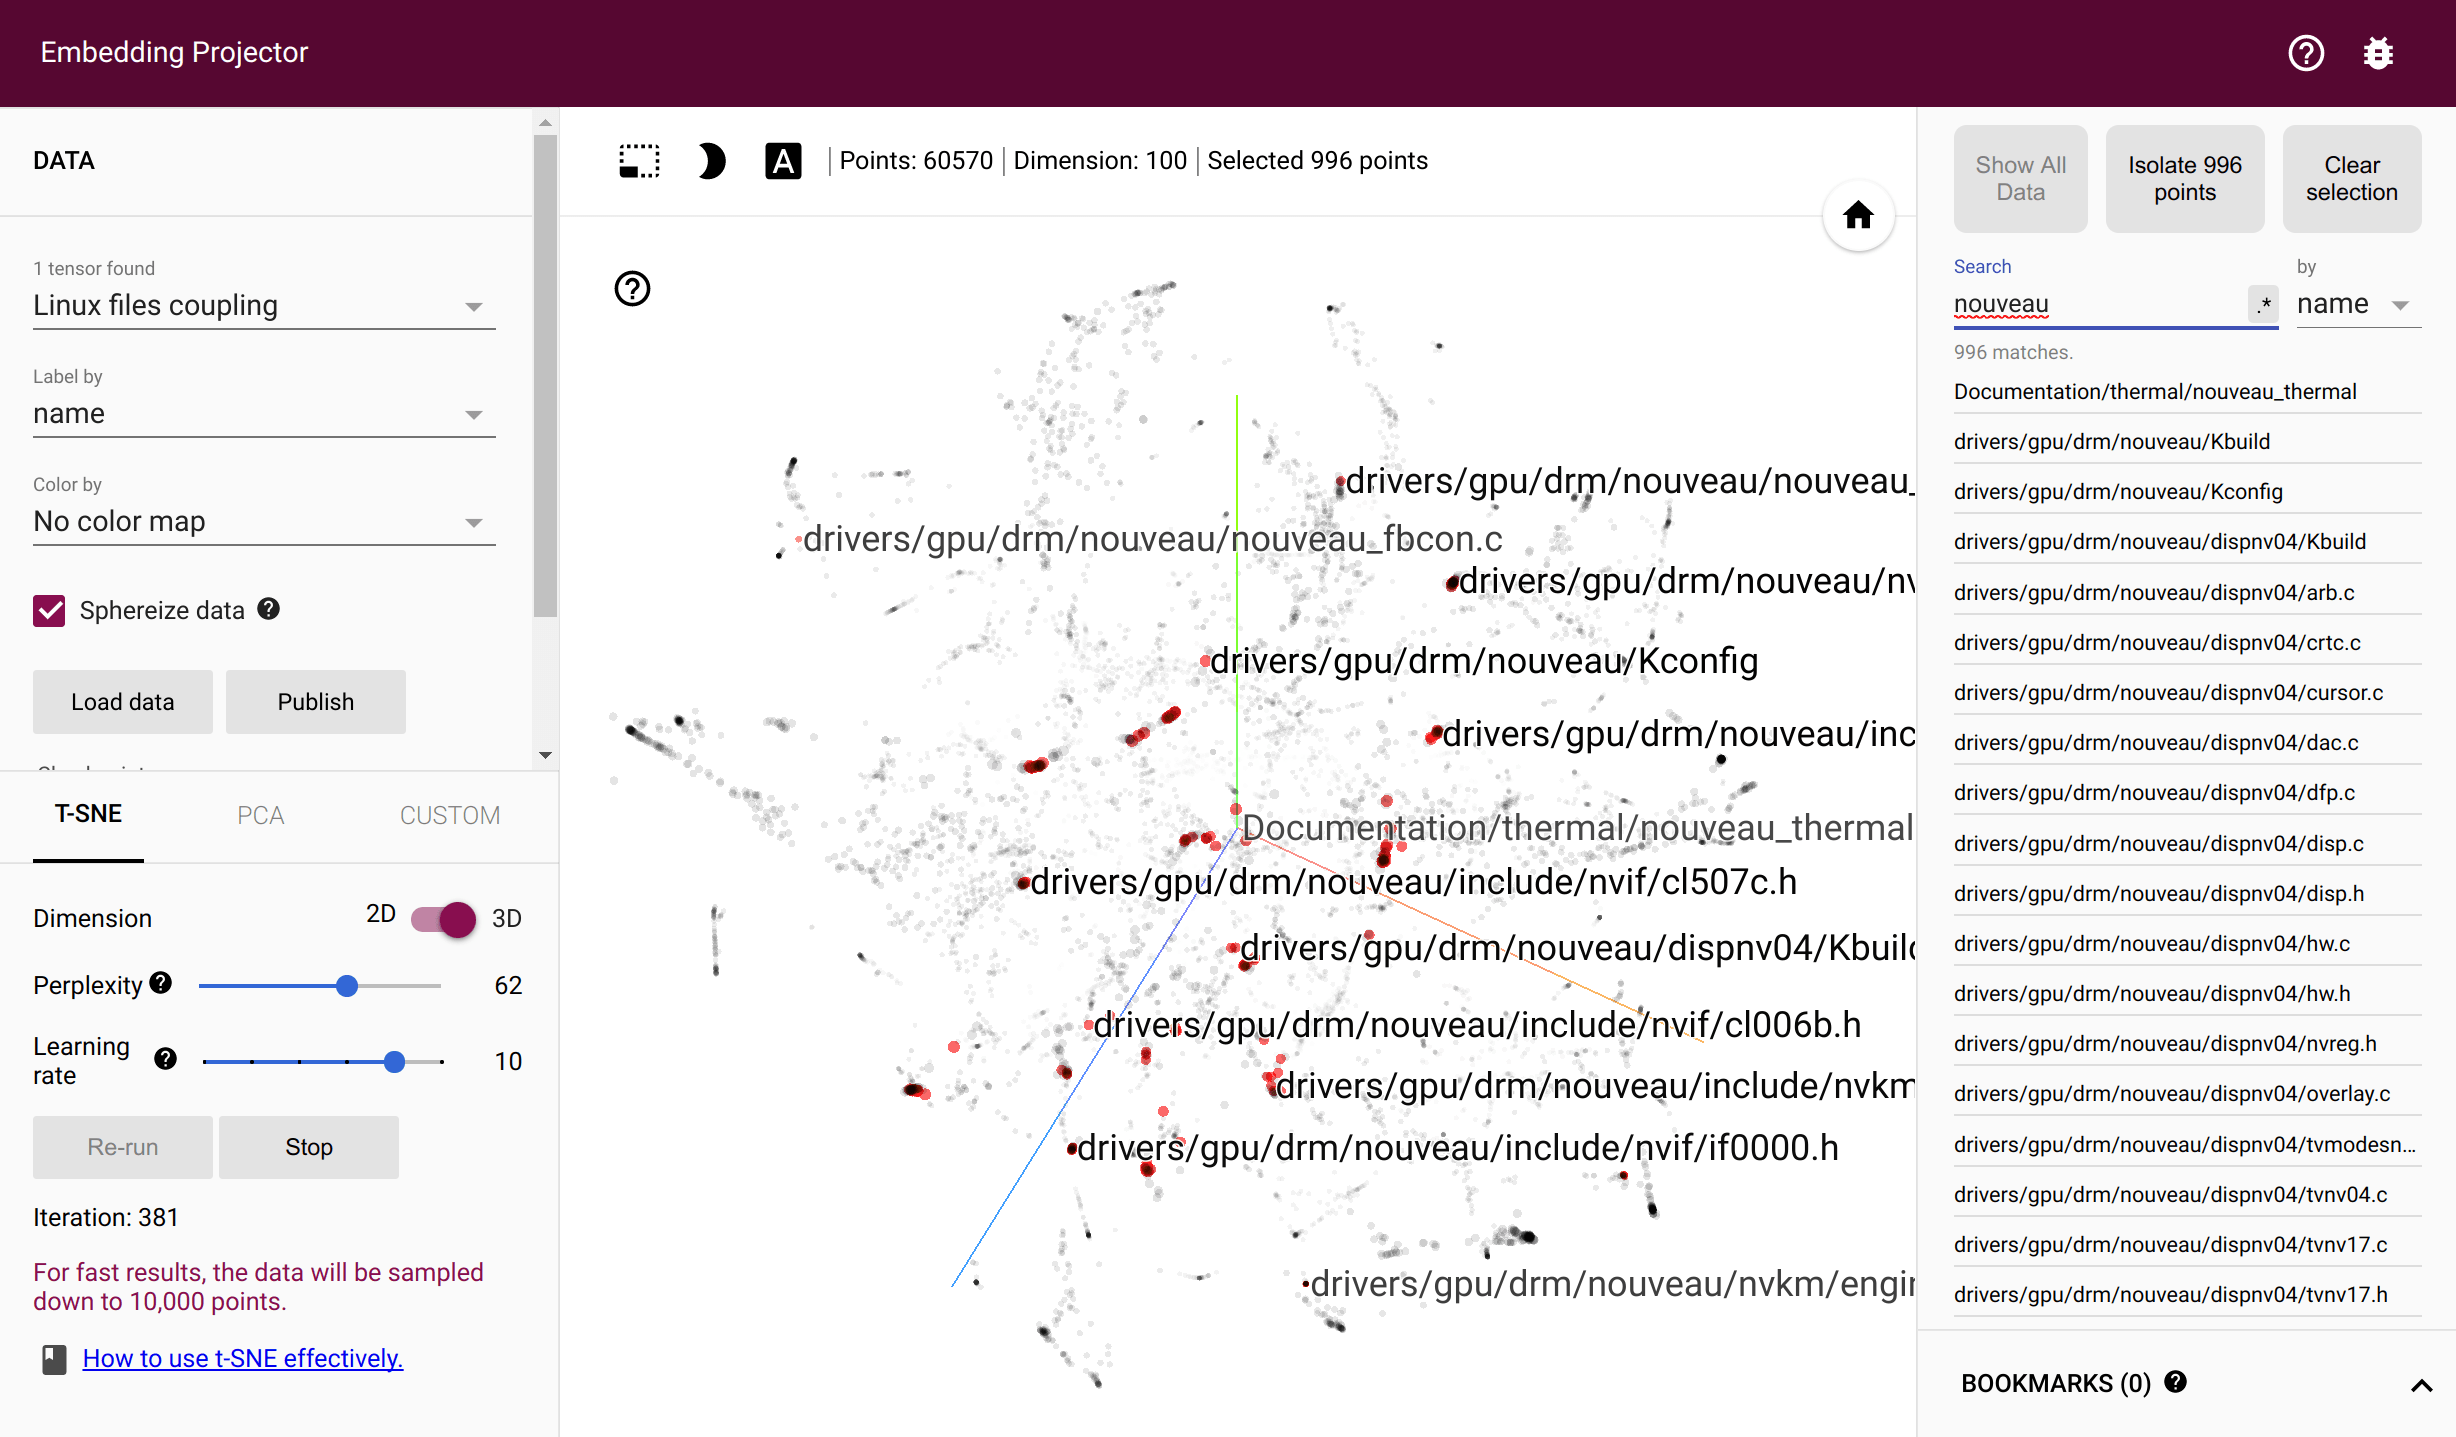
torvalds/linux files' coupling in Tensorflow Projector
```
hercules -couples [-people-dict=/path/to/identities]
python3 labours.py -m couples -o [--couples-tmp-dir=/tmp]
```
**Important**: it requires Tensorflow to be installed, please follow [official instuctions](https://www.tensorflow.org/install/).
The files are coupled if they are changed in the same commit. The developers are coupled if they
change the same file. `hercules` records the number of couples throught the whole commti history
and outputs the two corresponding co-occurrence matrices. `labours.py` then trains
[Swivel embeddings](https://github.com/src-d/tensorflow-swivel) - dense vectors which reflect the
co-occurrence probability through the Euclidean distance. The training requires a working
[Tensorflow](http://tensorflow.org) installation. The intermediate files are stored in the
system temporary directory or `--couples-tmp-dir` if it is specified. The trained embeddings are
written to the current working directory with the name depending on `-o`. The output format is TSV
and matches [Tensorflow Projector](http://projector.tensorflow.org/) so that the files and people
can be visualized with t-SNE implemented in TF Projector.
#### Everything in a single pass
```
hercules -files -people -couples [-people-dict=/path/to/identities]
python3 labours.py -m all
```
### Bad unicode errors
YAML does not support the whole range of Unicode characters and the parser on `labours.py` side
may raise exceptions. Filter the output from `hercules` through `fix_yaml_unicode.py` to discard
such offending characters.
```
hercules -people https://github.com/... | python3 fix_yaml_unicode.py | python3 labours.py -m people
```
### Plotting
These options affects all plots:
```
python3 labours.py [--style=white|black] [--backend=] [--size=Y,X]
```
`--style` changes the background to be either white ("black" foreground) or black ("white" foreground).
`--backend` chooses the Matplotlib backend.
`--size` sets the size of the figure in inches. The default is `12,9`.
(required in macOS) you can pin the default Matplotlib backend with
```
echo "backend: TkAgg" > ~/.matplotlib/matplotlibrc
```
These options are effective in burndown charts only:
```
python3 labours.py [--text-size] [--relative]
```
`--text-size` changes the font size, `--relative` activate the stretched burndown layout.
### Custom plotting backend
It is possible to output all the information needed to draw the plots in JSON format.
Simply append `.json` to the output (`-o`) and you are done. The data format is not fully
specified and depends on the Python code which generates it. Each JSON file should
contain `"type"` which reflects the plot kind.
### Caveats
1. Currently, go-git's file system storage backend is considerably slower than the in-memory one,
so you should clone repos instead of reading them from disk whenever possible. Please note that the
in-memory storage may require much RAM, for example, the Linux kernel takes over 200GB in 2017.
1. Parsing YAML in Python is slow when the number of internal objects is big. `hercules`' output
for the Linux kernel in "couples" mode is 1.5 GB and takes more than an hour / 180GB RAM to be
parsed. However, most of the repositories are parsed within a minute. Try using Protocol Buffers
instead (`hercules -pb` and `labours.py -f pb`).
1. To speed-up yaml parsing
```
# Debian, Ubuntu
apt install libyaml-dev
# macOS
brew install yaml-cpp libyaml
# you might need to re-install pyyaml for changes to make effect
pip uninstall pyyaml
pip --no-cache-dir install pyyaml
```
### License
Apache 2.0.